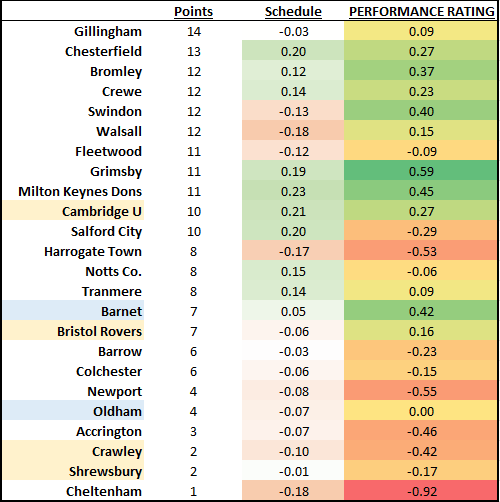
6 gameweeks in – that’s enough for my ratings to work fairly well so let’s make see how League two is shaping up for the season:
Light yellow highlight = Relegated from 2024/25 League 1
Light blue highlight = Promoted from 2024/25 National League
“Schedule” is equivalent to the expected goal difference per game of a league average team playing each team’s fixtures
“PERFORMANCE RATING” is equivalent to the expected goal difference of each team in a game against a league average side (neutral ground)
Points of interest
I see a lot more potential in Barnet than they’ve shown so far
Quite a close league in general, a lot of teams have potential to compete for the league if they can find a bit more performance
Similar to League 1 I want to check back at the end of the season and compare my points predictions to the points spreads of companies such as Spreadex.
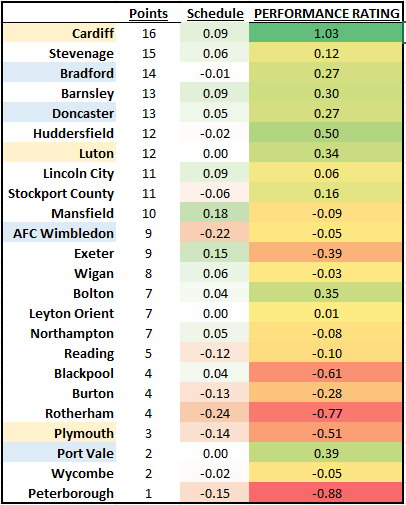
6 gameweeks in – that’s enough for my ratings to work fairly well so let’s make see how League 1 is shaping up for the season:
Table 1
Light yellow highlight = Relegated from the 2024/25 Championship
Light blue highlight = Promoted from 2024/25 League 1
“Schedule” is equivalent to the expected goal difference per game of a league average team playing each team’s fixtures
“PERFORMANCE RATING” is equivalent to the expected goal difference of each team in a game against a league average side (neutral ground)
Points of interest
Cardiff’s high-performance level immediately stands out. It’s unlikely this performance level won’t regress downwards (using weak prior assessments of their level and simply the fact the top performing team is probably due negative regression) but I would certainly say they are favourites to win the league.
Port Vale don’t have many points, but I rate their performances as 3rd so far! My ratings include a 20% weight on goals for/against – their performance levels would comfortably gap 3rd place if credit for goals were removed (which may not be an unreasonable thing to do for 6 games).
A lot of teams new to League 1 this year are performing strongly – this could be bad news for last year’s league 1 teams that expect to be improving or holding position this year.
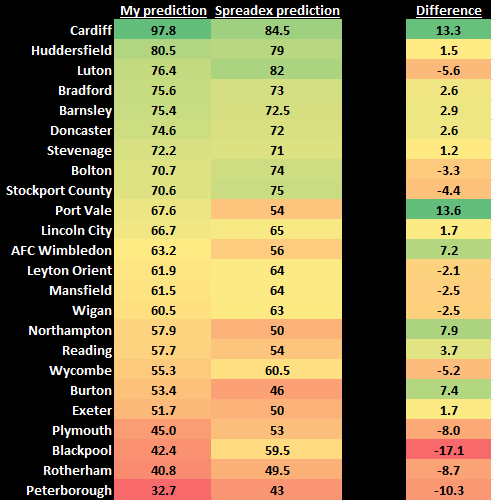
For fun I’m going to compare my expected points totals for each team to Spreadex’s and come back at the end of the season to review how my predictions performed compared to theirs:
Ideally, I’d probably regress my ratings for teams like Cardiff and Peterborough, but I haven’t sorted out a quantitative method for this yet. That’s part of the challenge though – can my ratings perform as well as the points spreads of spread betting companies simply using only 6 games of action?
Thanks for reading, please subscribe if you want to read more or get in touch with any questions (syzygyanalytics.bsky.social, x.com/samh112358)
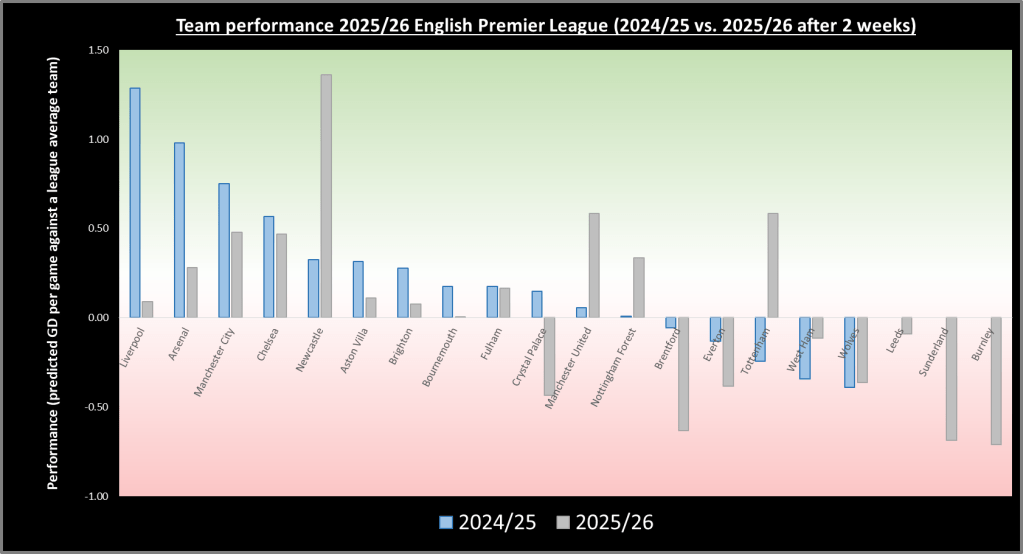
2 weeks in and the competitiveness of the Premier League is at an all time high. There have been some surprising performances by teams (Arsenal vs. Manchester United and Newcastle vs. Liverpool stand out) so far this season which results in some mixed-up performance ratings for each team’s first 2 games (see the light grey bars in the graph).
Arsenal
Arsenal put in a strong performance against Leeds affirming their title credentials, their untroubled defence as promising as all the goals scored. During fit spells last season, their performance levels were within touching distance of Liverpool. They’ve picked up some injuries already and made a slow start against Manchester United which will be a source of hope for rivals. Eze and Gyokeres will be important signings as an 80pts expectation can turn into 70 or 90pts without much difficulty.
Arsenal plays Liverpool this weekend at Anfield and the two teams are currently rated very close to equal in the betting markets (accounting for home advantage).
Aston Villa
Villa suffered a disappointing result against Brentford but carried a reasonable threat most of the game. They played like the ~6th best last season but the Europa League might be their best hope of extra excitement this year.
Bournemouth
I’ve seen Bournemouth rated close to +0.5 xGD per game in raw xG models for the 2024/25 season. I think that overrates how good they were, but they are still decent and have put in a couple of solid performances so far this season (despite some altered lineups).
Brentford
Brentford’ opening 2 performances show some cause for concern. Given the players they have lost (Mbeumo, Norgaard, Wissa (still at the club)) it’s understandable. Hopefully the incoming players can perform in their place (e.g. Ouattara from Bournemouth and Milambo from Feyenoord).
Brighton
A disappointing start to the season for Brighton who will be hoping for a strong season based off being potentially one of the strongest teams in the league with no European competition.
Burnley
Early days and a 2-match sample that includes 1 match against another relegation rival is not much to go on. They’ve been attracting some money in the betting markets in the first 2 weeks though, and at odds that imply they’ve got something about them…
Chelsea
Lots of goals against West Ham but for me I’m not seeing performance levels that imply they are likely title contenders. I am surprised they have been trading at >10% for the title so far this season.
Crystal Palace
Palace had solid top half performance levels last season, but these levels may be hard to maintain with the loss of Eze and probably Guehi.
Everton
Jack Grealish/Tierno Barry/Kiernan Dewsbury-Hall look like potentially strong signings and they haven’t lost any top performers from last season (so far in the window). Unless the promoted teams are really good, they will be able to avoid a relegation fight (Jarrad Brainthwaite’s fitness is important though).
Fulham
Fulham showed very solid performance levels through last season and have started similarly this season as well. Opta’s predicted table has them 15th for this year (https://theanalyst.com/competition/premier-league/table) and they are available as a 3.0 shot for top half (2/1 or +200) in long term markets neither of which I agree with.
Leeds
One good performance, one bad performance. Their betting odds rated them only slightly worse than Everton in their first game which is promising for Leeds fans (although Everton’s lineup for their first game looks a fair bit weaker than their lineup did for their second game).
Liverpool
Liverpool have started their title defence with a couple of questionable performances but it’s a little early to say whether they are going to drop off this season or not.
Manchester City
Last season City had their poor spell in the first half before recovering and stabilising around a performance level that was decent but not at a level that can compete for the title (at least not regularly). If Rodri is not the key to re-elevate them to levels of previous seasons, I am not sure they will be strong contenders for the title this year.
Manchester United
I’m of the opinion that Amorim has not had that long yet because last season was more of an EL campaign than an EPL campaign. If they don’t show performance levels that could compete for the top 6 over the next couple of months that would be unacceptable with United’s current squad (although I generally don’t believe managers are as important as they are made out to be).
Newcastle
2 very strong performances for Newcastle to start the season but often red cards can slightly randomise performance levels (beyond the required red card adjustment). It’s a shame about the Isak situation.
Nottingham Forest
2 solid performances for Forest so far. Their big performance drop off towards the end of last season and the reason behind it is a point of contention, if they’ve recovered from that I think they could surprise again this season. I’ve seen analysts saying they will struggle this season if they don’t lead so many minutes which is a very questionable theory – leading games generally hurts performance levels.
Sunderland
Their performances so far are not too much to write home about. I think it’s certain they will be in a relegation battle and it’s still hard to say where they stand. A lot of strong signings but if they don’t work out it’s possible Burnley might be stronger.
Tottenham
I think Tottenham are the stand-out team after 2 games compared to prior expectations. Last season was so EL and injury affected maybe we shouldn’t be so surprised. Their lineup (in attack anyway) is quite different to last season so uncertainty reigns but at this point even 3rd place could be quite plausible.
West Ham
A poor start – if Burnley or Sunderland can settle at a decent level there will be trouble ahead. Not as bad as the goals so far makes it look but I haven’t rated West Ham very well for a while, even for their 9th place finish in 2023/24.
Wolverhampton Wanderers
A poor start – if Burnley or Sunderland can settle at a decent level there will be trouble ahead. Yes, I just copy & pasted from West Ham – in fact the performance levels of these two teams last season were remarkably similar as well. Hopefully these teams can find a signing before the window closes.
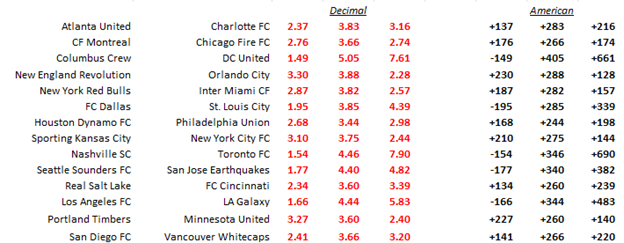
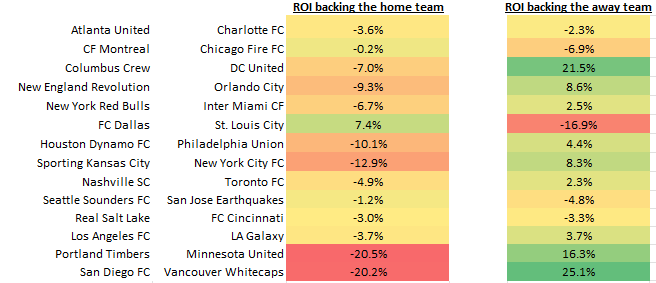
With Agyemang sold and Biel injured, I have NYRBs as a good bet not to lose here. Charlotte FC is on a 6 game win streak but I think it’s sure to end soon and hopefully this is the game.
Seattle Sounders vs. Sporting Kansas City
Showing as a good home bet but I’m not too sure here – I think I’ve not got enough importance on the Rusnak absence. Seattle also played mid-week so I’m leaving it.
Nashville SC vs. Orlando City
Orlando City are a favourite of my ratings right now and show as value here again. I have accounted a bit for Orlando’s midweek game so I will be backing them again.
Real Salt Lake vs. Minnesota United
Salt Lake have new plays such as Rwan Cruz, Victor Olatunji and DeAndre Yedlin from FC Cincinatti. They have also 3 suspensions including Diego Luna so it’s a tricky one to gauge. I’ve already sided with Minnesota somewhat and there may still be value if RSL’s new lineup is not stronger than their average.
GOAL LINES
Just a quick bit on my total goals predictions
The orange and red on the right means I’m a bit low on my total goal counts across the board. The MLS HAS dropped from 3.15 average goals per game last season to 2.93 which probably explains this however it surprises me how total goal expectations seemingly require more regression than individual team ratings.
My method for calculating total goals is possibly the culprit here I am not sure. It goes something like this:
Calculate each teams total goals/xG per game removing the xG per game added by being better or worse than their opponents (a difference in ability creates extra (x)GPG.
Calculate the difference of this adjusted home team GPG and away team gpg to the league average gpg. E.g. home team = 3gpg, away team = 2.5 gpg, league average = 2.7 gpg. Home team = 0.3 gpg, away team = -0.2 gpg.
Sum the home team and away team differences (league average +0.1 gpg)
Use a relationship between the difference in ability level of the 2 teams to gpg % added to create a final figure
I can work on a clearer explanation here although maybe my method isn’t deserving of one…
If I regressed my total expected goals numbers to what I would have expected last season they would match up much better with the betting markets. I’m not sure why total goals seems to require more regression than team ratings. More work required!
Week 1 of the new season is done so let’s look at how each team opened their campaign. I’m going to analyse each team’s opening performance using my team ratings that heavily focus on predicting future performance rather than just describing what happened.
As we only have 1 game so far, I biased my rating system not to goals and big chances but towards passes and shot counts. My rating system:
Only looks at on pitch events
Includes many relevant adjustments such as fixture, red cards and game state
Ignores goals (for today only)
I’ve doubled the value of dangerous passes (for today only)
The title contenders/top 4 contenders’ markers are to illustrate how different performance levels correspond to different end of season outcomes. It does not mean ‘I think Brentford are going down’, it means if Brentford perform every week at this level they will almost certainly be relegated.
I’ve estimated ratings for each team to use as fixture adjustments. This is harder for promoted teams that are new to the division so might mean their opponents performances got over/under rated.
Liverpool vs. Bournemouth
Liverpool’s performance on Friday rates as steady but not exceptional. In turn this means Bournemouth’s performance was very respectable. Whether Liverpool will be regarded as England’s finest again come May is very much up in the air.
Aston Villa vs. Newcastle United
Even with credit reduced for Newcastle’s play while up a player this still rates as a strong Newcastle performance. However it does seem to me that, even when adjusted for, red cards still skew performances quite randomly. Villa had a poor first half but started to look much more competitive in the 2nd half until the red card incident (admittedly the red card was essentially a big chance conceded). Overall though Villa’s performance was one of the poorest relative to expectation of any team in week 1.
Brighton vs. Fulham
A fairly ordinary performance from Brighton in my opinion. On Soccer Saturday they said Fulham had a big chance before their equalizer, but I never saw it in any highlight videos? I think Fulham are really solid but they’ve not really signed anyone and the strength/depth of the PL is only going up (I don’t think they are relegation candidates however).
Sunderland vs. West Ham
Sunderland’s performance bar may look surprisingly low to you on the plot but if there weren’t any surprises would there be any point to this article?! Take out the goals and their performance level on Saturday does not wow. The performance indicated is still higher than all the relegated teams from last season however – it would be great if we have a bigger relegation battle this year.
Tottenham vs. Burnley
Large betting syndicates put big money down on Burnley in this game as Tottenham kicked off at only an implied chance of 62% to win the game (down from ~72% just a day prior). This is a good sign for Burnley, but the result wasn’t. The performance wasn’t great but could have been much worse – again there’s hope that a new promoted team is going to be competitive.
Wolves vs. Manchester City
Yes Manchester City cruised to an easy win but the theme of this week is another performance that wasn’t absolutely crushing. Manchester City’s performance here projects a performance of about +1 GD per game for them which is below Liverpool’s performance last season.
Chelsea vs. Crystal Palace
Eze’s disallowed free kick will be the main memory for most, but my analysis interprets this as a good Chelsea performance. Can they be title contenders – my view is they are a bit away still.
Nottingham Forest vs. Brentford
Forest played well last season, but their performance really degraded towards the end which was a worry for this season. Possibly it was fatigue though, as they have started this season with a strong game. I’ve seen some analysts discredit their performances last year because they took early leads and spent a lot of time ahead? I don’t agree with this take, I think leading game states are more difficult. I have written 2 articles so far on this topic if you want to read more:
My game states adjustments that boost Arsenal for sitting on lead all game can only do so much so, as you might have expected, United’s performance on Sunday does rate well. I think Gyokeres was a fairly big issue for Arsenal’s attack. I think this game must have been a baptism of fire for him – such a difficult tie in the Premier League with a new team. His career progression is quite unusual for a centre forward expected to lift an already elite team to a title (he is 27 and had barely played opposition from the top 5 leagues before this game.)
This could be Arsenal’s year at last, but if you exclude the result, this game alone is not saying it will be. Manchester United are going to improve by for a number of reasons this season but how much is difficult to answer.
Leeds vs. Everton
This was a strong performance from Leeds – maybe they won’t even be in a relegation fight this year…
You can get in touch with me about anything at x.com/samh112358 or syzygyanalytics.bsky.social
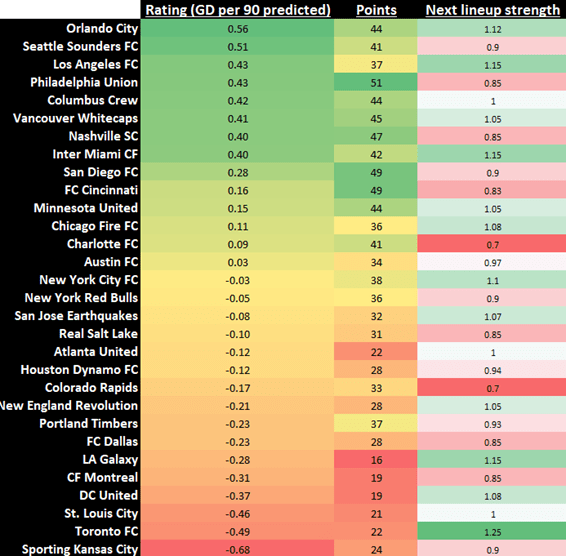
The MLS season begins to approach the ‘run-in’ (8 full gameweeks left) and the conferences are close and exciting.
It looks possible the top of each conference will become even tighter as some of the teams that are currently adrift have strong underlying performances.
The ‘Next lineup strength column’ is used for my betting predictions below. I am estimating the strength of each team’s current starting XI vs. their average lineup for this whole season. For example, LAFC are likely putting out a stronger lineup for their next game (with the signings of Son and a fairly fit team) whereas Charlotte FC have sold players and have key injuries (e.g. Pep Biel).
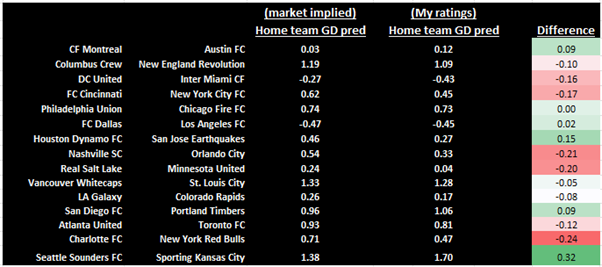
On to this weekend’s matches:
The green cells in the right-most column mean I rate the home team’s chances as higher than current betting market (Thursday 14th August). I think a 0.1 goal difference is necessary to even consider a bet. I got the idea to compare the match lines like this from a Ted Knutson article on thetransferflow.com earlier in the year.
Orlando City vs. Sporting Kansas City
This is showing as the standout bet of the weekend. Sporting Kansas have spent a lot of minutes losing and have a very poor big chance difference, both of which earn them quite large negative adjustments. Robert Voloder (who looks like an important defender) has just returned but Erik Thommy and Joaquin Fernandez are likely out. I hope this is a wash but Kansas’s decent performance last time out against San Diego does worry me a bit. Orlando has lost Cesar Araujo to suspension, but I don’t think he’s extremely key. Back Orlando -1.25 at 1.88+ / -114+
CF Montreal vs. DC United
I don’t think either of these teams have been quite as poor as their miserable league position. Both teams recent performances have been really poor though. I have a small lean to DC United but not enough for a bet right now unless something changes.
New England Revolution vs. Los Angeles FC
Showing some value on New England but I’m not very confident about it. Matt Turner looks a good upgrade in goal for NE but Son’s influence is fairly large. LA also have signed Mathieu Choinière. I am close to backing New England not to lose but leaving it for now.
Toronto FC vs. Columbus Crew
Granted Toronto FC have been very poor for large parts of the season but their 1st XI is starting to look decent to me. Milhailovic is a strong signing, Flores/Laryea/Pettreta/Osorio are fit. Matty Longstaff has left but I don’t think that hurts them too much. Toronto did used to have Bernardeschi so I’m not totally confident, but I will have a bet on Toronto not to lose at as close to evens (+100) as possible.
Vancouver Whitecaps vs. Houston Dynamo
Vancouver have just signed Thomas Muller while Houston have a decent looking new central defender called Antonio Carlos. I expect Muller to make more of a difference than Carlos and Vancouver are quite surprisingly strong this season so I’m going for a small bet on Vancouver Whitecaps at 1.7 (-140).
Keep an eye on my blog for another part on game state analysis and also some Premier League performance reviews when the season starts! Contact me at x.com/samh112358 or syzygyanalytics.bsky.social about anything!
In this series of articles, I am going to be analysis the effects of game-state in football. I am going to consider
The effect of game state (e.g. the game is tied, 1 goal separates the teams e.t.c) on various metrics (goals, shot ratio, xG e.t.c.)
How I adjust my metric to reduce the effect of game state for predictive purposes
What optimal strategies a manager should use to maximise performance
In this first part I am looking at how goal difference is affected by game state.
Introduction
I suspect game state complicates our goal of accurately assessing a team’s performance. We need to comprehend how it influences a team’s performance and the magnitude of said influence.
Let’s think about what the broad influence of a game-state might be:
When a team leads by a small margin, especially late in the game, they have a reduced incentive to score more goals. They would be happy with the current scoreline as a result. Similarly, when a team trails in a close game, they have an increased incentive to attack. This factor would result in the trailing team attacking/scoring more and the leading team attacking/scoring less.
A team that leads a will find it easier to attack and score because the opposing team is forced to disregard their defense to turn the game around. This could mean they leave gaps in their defence which can be exploited. This factor would result in the leading team attacking and scoring more while the trailing team attacks and scores less.
A game that is not close may see reduced intensity. The leading team doesn’t need to score more, and the losing team may be unmotivated with little to no chance of turning the game around.
We mainly want to focus on whether a) or b) plays a more significant role in close football games. Let’s look at some data.
How is goal difference (GD) affected by game state
Table 1
When looking across a whole league like this, the goal difference in tied games must be 0. This is because for every goal scored at zero a goal is also conceded at zero. A leading game state is different – a goal scored in a leading state is a goal conceded in a separate (losing) state.
As we can see teams generally improve their GD when they lead.
Does this mean point b) above is a more powerful influence than a). We cannot say that yet, there is a lot more to consider.
Let’s consider a match between 2 specific teams. Team A (of general ability +0.5 GD per game) plays at home against Team B (of general ability -0.4 GD).
While the game is tied, we expect team A to enjoy an average superiority of 1.2 GD per game. (there is a difference of 0.9 GD in ability, and we assume a home advantage of 0.3 GD).
Now we let these teams play each other in a large sample of games. If we observed team A having a +0.7 GD per game during the periods they lead, we can see it’s worse than what their abilities would have predicted so the leading game state is having a negative effect on their performance.
If we adjust for the ability of the teams involved the goal difference of the leading team is 0.5GD per 90 worse than expected. This is our ‘adjusted goal difference’.
How is fixture adjusted goal difference (GD) affected by game state?
I can do a similar measurement for whole league seasons. The expected performance of teams while they lead will be the difference between the average ability of leading teams and trailing teams plus an adjustment for the average extra amount of time a leading team will be at home rather than away.
I can work these things out for the leagues used above. What performance do I expect from teams that are leading?
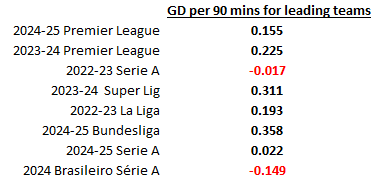
Table 2
The first column is raw goal difference while teams are leading.
The second column is what the goal difference for leading teams would be if game state had no effect. As you can imagine, it is fairly guaranteed that over a whole season, teams that lead games are on average better teams and also more leading minutes will be at home grounds rather than away.
The third column shows us that leading teams perform worse than would be expected if game states had no effect. It’s interesting there’s 3 premier league seasons in a row where leading teams did not drop their performance – probably just randomness though!
Extra detail
Now let’s look into specific leading states – it may tell us more about why we see this under performance.
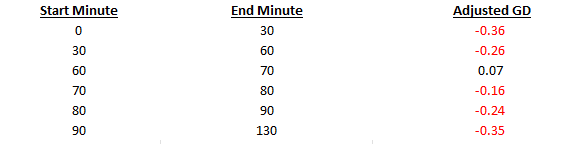
Table 3
This shows the underperformance happens in 1 and 2 goal games rather than games that don’t have a close scoreline. Whatever is causing the underperformance is clearly stronger in closer games.
It is also relevant to consider if these differences are more connected to changes in the attack or defence.
If we saw that 1 goal/2 goal games were lower scoring overall, it could imply the leading team was shutting down the game efficiently to preserve their lead. This could help convert a lead into a win and hence isn’t really ‘lower performance’ even if the goal difference per 90 was lower.
Table 4
From this table you can in fact see teams become higher scoring when not in tied states.
We need to consider an adjustment here as football games become higher scoring as full time is approached and leading states are more likely to occur towards the end of the match.
Table 5
The total goals here are a factor relative to the total goals scored between minutes 0 and 10. This table shows the goal scoring rate really in games really increases a lot as the match clock ticks on, even when we only filter for tied game states.
Using this table and the time spent at different game states I can calculate how much higher scoring leading/trailing states should be if the only influence was the idea that leading/trailing states are more common later on in games (as goals have had time to go in).
I calculate factors of 1.14, 1.22 and 1.26 for 1 goal, 2 goal and >3 goal games (i.e. 2 goals games should be 22% higher scoring because 2 goals leads are more likely to be during the latter stages). Using this factor to correct the previous table gives
Table 6
Leading game states don’t look higher scoring anymore, but they also aren’t lower scoring. It’s possible that some teams will be capable of shutting down a game when they lead but it doesn’t appear to be a very common skill. I plan to consider ‘tactical advice’ for teams with respect to game state – I think this topic of total goals will be important. I am finding little evidence that playing more defensively when ahead improves goal difference (in some separate analysis) so I’m thinking it might only be the ‘correct’ tactic if it can shut the game down. More on this in future articles!
What minute of games is underperformance more relevant?
I calculated adjusted goal difference (observed GD in leading states minutes expected goal difference based on team strengths) in leading states for some different time bins for 4 leagues (last 3 PL seasons and 2022-23 Serie A..) and got the following result
Table 7
There is no trend here – it seems like leading teams underperform across every minute.
Goals will often prove hard to work with because they are too random! Ideally I could use a much larger sample here but I don’t have time for everything.
Since I showed table 2 we have learnt that most/all of the underperformance of leading teams is at +1/+2. We have also learnt that the underperformance is probably not strongly related to match minute or as a result of games becoming lower scoring overall.
Conclusion
This underperformance is relevant for modelling football results. The Poisson distribution is one of the most popular ways to calculate the odds for a football game. Goal scoring fits the Poisson distribution fairly well because the mean number of goals expected is approximately equal to the variance of goals scored. It famously underestimates the draw price of games and we’ve just seen why – as soon as teams lead, they start playing worse! This creates a bias for games to return to drawn scorelines.
My current feeling is that this is down to loss aversion. This is a common phenomenon in sports where we observe competitors and teams more motivated to avoid something bad than achieve something great. In golf, professional players make more par putts than birdie putts as the incentive to avoid a bogey appears more powerful than the incentive of achieving a birdie. (https://www.aeaweb.org/articles?id=10.1257/aer.101.1.129)
In the case of game states, it may be teams that are losing can dig deeper and find more motivation than teams that are winning. We saw that the effect gets smaller in 2 goal games and especially 3 or more goal games which fits with motivation for the losing team beginning to reduce as they their fate becomes more sealed. Another example in football can be seen with teams that are fighting relegation. It is more common to see teams fearing the drop find more performance than it is to see teams find extra performance when a top 4 finish or title is on the line.
What we have found here today could be an important piece of the puzzle in future analysis!
Next time I will look at how more complex metrics are affected by game state.
Please comment if you have any questions or dm me at https://x.com/SamH112358. Also, you can subscribe to the blog if you wish to get notified about future posts.to play slightly better going forward due to the team regressing to an expected proportion of time in game states that facilitate a better GD.
In the first part we looked at how goal scoring is affected by game state and found out that leading teams/trailing teams perform worse/better than would be expected respectively. In this part we are going to look beyond goals and consider shots and xG.
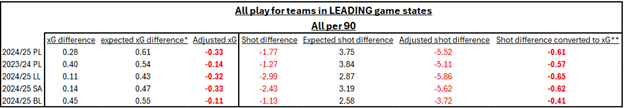
To start it will be illuminating to discover what effect losing/winning has on a team’s performance when we measure that performance using shots or xG. I used xG data for 5 leagues from understat.com and shots using Opta data from whoscored.com.
Table 1
*The expected difference is the performance we would expect based on the ability of the teams. It’s always going to be positive on a large sample like a season because leading teams are always better teams on average.
**About 1 in 9 shots result in a goal. To compare shot difference to xG difference it is divided by 9 for this final column.
We can see that shots are more affected by game state than xG – leading teams create more xG but shoot less than their opponents. Adjusting the shot difference metric for game state will be a larger adjustment than the one for xG.
Goals vs. xG
In the first article on game state, I focused on how goal difference is influenced by different game states. It’s interesting to compare the xG figures from above to goal difference from table 2 in the first part of this series. Pulling the data for the same 5 leagues from that table
Table 2
The last 2 columns show a close agreement between the underperformance in goals and xG for each league. This is a good thing for the understat xG model – game state does not influence goal conversion in a way that xG does not capture.
Adjusting a team’s performance for game state
As shown above, goals and the xG metric that understat.com uses are affected equally by game state so the following could be considered as an adjustment for either goal difference or xG difference.
The purpose of a potential game state adjustment is to improve a metric so that it will become more predictive. If a team is going to underperform whenever they lead, it follows that we don’t need to adjust for underperformance while leading in the past.
The relevant point is whether a team has led/trailed in different proportions than would be expected going forward. If the team has trailed for a surprising number of minutes, they will have benefited from the trailing game state more than they will benefit from the trailing state when their trailing/leading minutes return to a more expected value.
In order to go about making this adjustment, firstly it is necessary to create a relationship between team performance and the expected leading/trailing minutes of said team.
Correlating some league data can give a relationship between performance and time trailing/leading. The correlation used is xG difference for a team (i.e. performance) and fraction of time leading or trailing. This gives an approximate relationship of:
Time expected to lead = 0.15 * xG diff. per 90 + 0.25
Time expected to trail = -0.15 * xG diff. per 90 + 0.25
Considering a league average team with a zero GD/xG, this shows on average they will spend 25% of the time trailing, 50% drawing and 25% leading.
A team with a performance level of +0.5 xG diff per 90 is expected to spend 17.5% of the time trailing and 32.5% of the time leading.
It’s useful to do 1) subtract 2). This gives
proportion of time leading – trailing = 0.3 * xG diff. per 90.
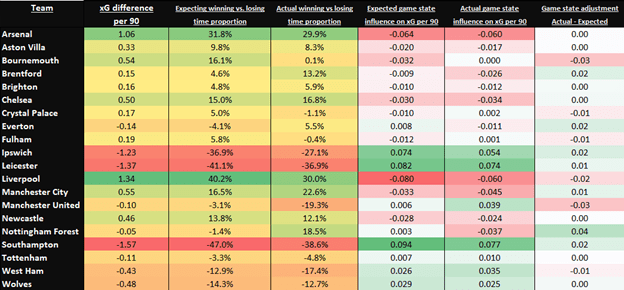
Using this formula for last year’s Premier League season gives the following table:
Premier League 2024/25 season adjustments
Table 3
The first (numerical) column is the xG performance of each team.
This figure is used in formula 3. to create the second column.
The third column is the actual proportion of time each team spent winning and losing last season.
The fourth column uses the (global) value of -0.2 xG per game for winning teams to calculate the effect of game state using predicted time spent winning and losing. E.g. Liverpool’s rating is so strong they are expected to spend 40.2% more time winning than they are losing. This would damage their xG difference by 0.08 a game. Southampton are expected to spend 47% more time losing which would benefit their xg difference by 0.09 a game.
The fifth column does the same calculation using each team’s actual time spent winning/losing.
The final column is our game state adjustment for xG (expected game state influence – actual game state influence). Nottingham Forest for example spent a surprising number of minutes leading when considering their league average xG difference. Their xG difference suffered because of this and as they are not expected to experience so many leading minutes going forward this results in a positive adjustment. Bournemouth spent a surprisingly large number of minutes not winning and so their xG benefits because of this.
There are quite a lot of assumptions being made here:
The blanket approximation that all teams underperform by 0.2 xG per 90 and overperformed by 0.2 xG per 90 while trailing may not hold. There could be several reasons for this such as individual teams employing different styles in different game states or added nuance that I am yet to consider such as better teams not experiencing weaker performance while they lead.
The ratings used for each team are accurate (for example I don’t think Bournemouth were/are as good as their xG difference which affects the game state adjustment.)
Shot difference adjustment
Table 4
The game state adjustment for shots follows a similar process to xG. Shot difference can be converted to an xG equivalent by diving the shot numbers by 9 (so formula 3 from above can be used).
The game state effect for shots is around -5.1 per 90 for leading teams (which is a larger effect than -0.2xG per 90)
I could do an iteration and use a GS adjusted shot difference per 90 rating for estimating expecting winning/losing times, but the result will not be significantly different.
Summary
Summarising the adjustments calculated for xG and shots:
The adjustments for shots are larger than the adjustments for xG. Brentford are significantly underrated by just shot counts, but the game state adjustment helps to move that rating in the correct direction.
These adjustments are fairly broad and make assumptions such as
Leading/trailing game state effects don’t change depending on the team in question
Leading/trailing game state effects don’t change depending on the minute of the game
Leading/trailing game state effects don’t change depending on the relative ability of the teams
Some of these may be reasonable assumptions but some may not.
In the third part of my series of game state articles it will be interesting to look at how passing metrics are affected by game state. These passing metrics could add an extra layer of depth to game state adjustments.
Thanks for reading and please get in touch about anything on x.com/samh112358
Also subscribe if you wish for notifications when I post new material!
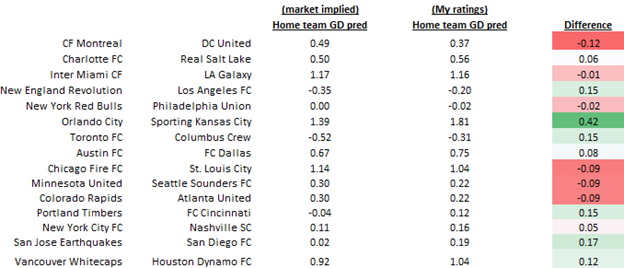
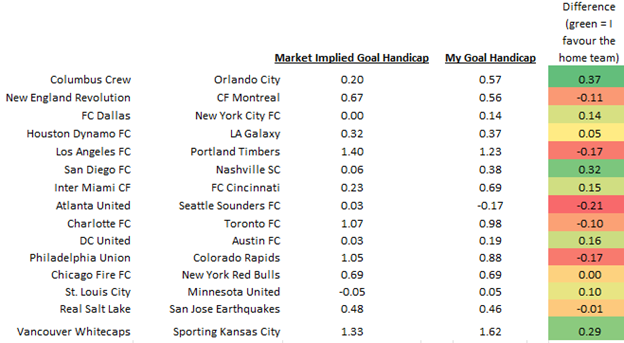
Inspired by a betting article from Ted Knutson at thetransferflow.com I’m now comparing my goal handicap line to that of the betting market.
Check out my team ratings here:
Columbus Crew vs. Orlando City
I didn’t see enough in this for a bet but then there was money for Orlando today. Hmm.
Now I have it as a Columbus bet. I rate them as the best team and Mohamed Farsi being out is countered by a fit team otherwise (i.e. they’ve not had every player fit all season). Orlando are good as well but better than Columbus (this is implied once you remove home advantage)? I don’t think so.
FC Dallas vs. New York City
Is Lucho Acosta playing? It’s frustrating not knowing these things. He’s not listed as out anywhere but I can’t find anything saying he’s back in (after being out for personal reasons). I’m close to a Dallas bet but NYC have got better as the season has gone on. My ratings don’t give any credit for stronger recent performances unless the team is using a lot of new players (I don’t think NYC are). Thiago Martins is out as he’s having knee surgery so if Acosta is in maybe I like Dallas.
San Diego vs. Nashville
This line has been going up and down a bit. Nashville get some negative regression in my ratings for not being as good last season with a similar team. San Diego have defensive injuries which are tricky to judge but if San Diego approach 2.7 (+170) again, that looks big to me.
Atlanta vs. Seattle
I can’t see any important injuries so a Seattle bet looks ok here. Seattle’s lineup looks as solid as it has been all season. (but my ratings already consider this)
Vancouver Whitecaps vs. Sporting Kansas
I rate Kansas as the worst team. Vancouver are a little odd, as with an apparently weaker lineup this season (no Ryan Gauld) they have one of the best teams in MLS. There’s a case for regression on both sides here so I’m swerving for now. I will probably kick myself if money comes for Vancouver..
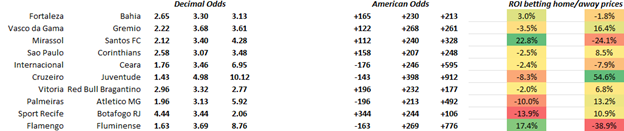
These are my estimates of true odds for this weekend’s matches. I’ve had a good couple of weeks with plenty of lines moving in my favour (sorry I didn’t post mid-week).
I’m not very confident about DC United, I’m not sure about their team (Benteke out?) and longer prices inflates the ROI. (I’ll work on a better way of displaying this.)
St Louis didn’t play midweek which I haven’t included in my odds so that reduces the interest there a bit.
My favourite bet is Minnesota this weekend. Vancouver look good as well although late money often opposes them. They rate well this season but it’s a bit surprising they rate as well as they do (no Ryan Gauld and they weren’t this good last season.)
Santos have Neymar now and I’ve probably not got enough weight on it. I have been high on Mirassol so I’m not ruling out them shortening a bit. Juventude could be a good handicap bet, both could be due a bit of regression vs. current opinion. Flamengo I think they will have a stronger lineup than I’ve used for these prices so I’m not too confident there. Sport Recife have some nice new players that probably aren’t getting quite enough weight.
I’m working on a lot of new content, including more game state material (considering if teams should take a different approach when they lead) and more about my ratings that produce these odds, stay tuned!