This week I have done some analysis looking at the performance of teams’ home and away. I want to test whether some grounds really are fortresses and some teams do better than expected when playing away.
This is a separate conversation to home advantage which is an ever present and significant factor in every professional football match not played at a neutral ground. Today we are considering whether some teams may enjoy more or less home advantage than overall averages.
In order to be a good analyst on a sport like football ones needs an excellent perception of what is signal and what is noise. If teams played half their matches with white stickers on their boots and half their stickers with black stickers we would observe many teams experiencing completely different form with the each type of sticker. In this instance you should be able to see all ‘sticker based’ form would just be noise. Home and away games are similarly split 50/50 so should we consider home and away form in the same way? In my opinion an analyst who assumes everything is noise until solid proof to the contrary arrives is a better analyst than one who finds patterns and structure everywhere.
Let’s see if we can find any evidence of teams maintaining strong home or away form.
Analysis
In order to test this, I am going to use goal difference and xG.
The xG is my own shots & passes metric, but for simplicity I’ll refer to it as xG.
I am going to use 290 team seasons (the last 3 years of the big 5 leagues in Europe) for this analysis today. Thanks to whoscored.com and Opta for the data.
For each team I need to calculate the following:
- Goal difference/xG at home for the 1st half of the season
- Goal difference/xG at home for the 2nd half of the season
- Goal difference/xG away for the 1st half of the season
- Goal difference/xG away for the 2nd half of the season
- Expected goal difference at home based on average home advantage and opponents for the 1st half of the season
- Expected goal difference away based on average away disadvantage and opponent for the 1st half of the season.
- Expected goal difference at home based on average home advantage and opponents for the 2nd half of the season
- Expected goal difference at home based on average away disadvantage and opponents for the 2nd half of the season
Difference between home/away performance for the 1st half of the season is given by (1-5) – (3-6) while home/away relative performance for the 2nd half of the season is given by (2-7) – (4-8). If there is a positive correlation between these 2 results it means some of that home or away form skew is being retained and hence not the result of luck.
For example, say for the first half of the season, a league average team A has an xGD of +0.5 per game at home and -0.4 xGD per game away. Let’s also say they’ve faced an equivalent easier schedule at home (expected to perform at +0.1xG per game) than away (-0.1xG per game) and home advantage across the league is +0.3 xG per game. Using the method this gives a home/away skew of (0.5 – (0.3 + 0.1)) – (-0.4 – (-0.3 – 0.1)) = +0.1xG per game. Team A are therefore performing 0.1xG per game better at home for the first half of the season than away. We could then do the same calculation using figures from the 2nd half of the season to calculate the teams’ home/away skew for the 2nd half.
Results
Rather than show a lot of messy plots I made a table showing the slope of the relationship between home/away skew as a percentage. The percentage shows how much of the home/away skew is retained for each item for each season or year.
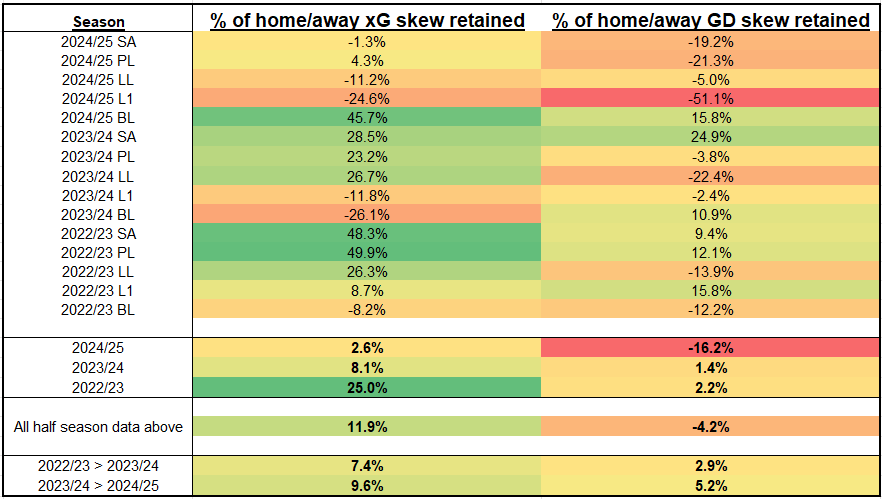
Table 1
League by league we see quite random results (remember we are correlating home/away skew from the 1st half of the season to the 2nd half). One season we see teams maintaining their superior home or away form through the season (positive percentages) then for another season superior home or away form apparently predicts the reverse. This wouldn’t make any sense so must be the result of noise.
Looking towards the bottom of the table starts to paint the picture more clearly. I have averaged the by each each and for all 3 years. We get a slope of .119 across all the leagues which means about 12% of the home/away performance xG skew for teams in the first half of a season is retained by teams during the second half of the season. Using the team A example from the previous part, 0.1xG at home means we could expect them to overperform at home in the 2nd half of the season by just 0.012xG per game!
Goals however just appear to be too infrequent and random to find any correlation between half seasons, even though I have used 290 team seasons.
Looking between whole seasons gives some satisfying results as ~8.5% of home over/under performance is retained when using the xG metric while ~3.5% of home over/under performance is retained when just looking at goal difference.
Conclusion
My takeaway from this is while home/away form is largely the result of randomness, there could be rare instances that considering a team’s home/away form could have an impact. If we have a prior belief that a stadium may offer its home team extra home advantage that may be more valuable than any noisy data we have.
Using just goals was useless over half a season but when comparing whole seasons we saw a small correlation. If your team seems to be getting betting results home or away that trend is likely just the result of randomness!
I believe the metric I’ve used for ‘xG’ in this article is a lot less noisy than raw xG models so I would have strong reservations about putting any consideration into home/away skew when using xG unless we are talking about home/away overperformance over a period of 1-2 years or more.
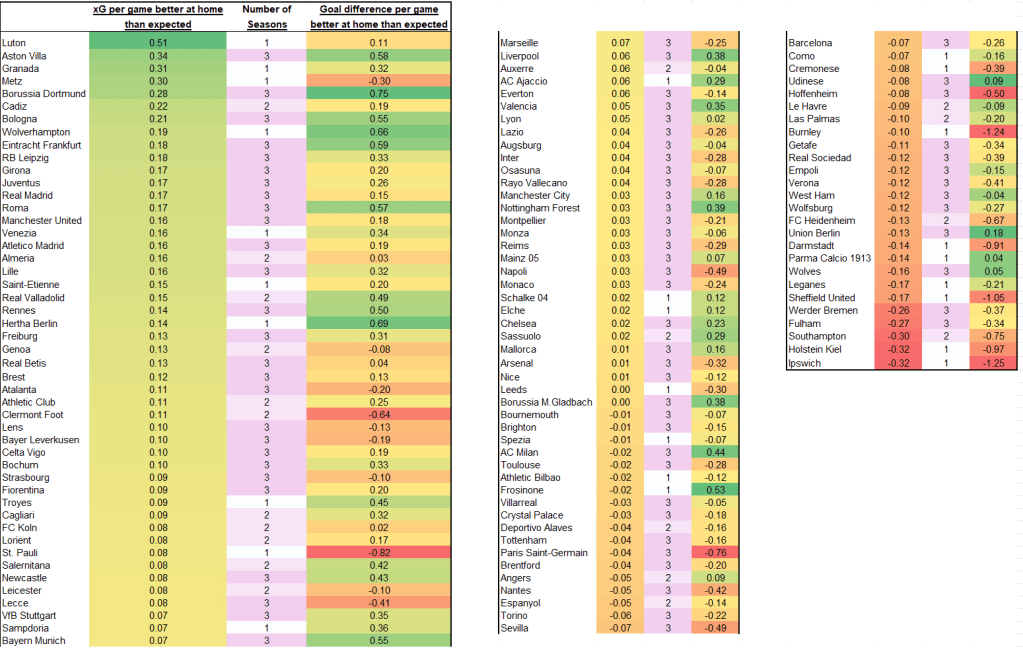
To finish with I’ll leave this table of home over/under performance for every team. The table is split into 3 parts for display purposes. Does the position of any teams match up to your expectation? Remember about 90% of the deviation of xG per game is likely random chance over 1 season (maybe less over more seasons) and teams at the extreme ends of the table are likely to have experienced some extra variance home or away. I may revisit the topic with more data, if you have any questions or ideas about this I would love to hear them.
If you enjoyed this piece today you can subscribe by inputting your email address in the white box on the home page syzygyanalytics.co.uk! Thanks for reading!

Leave a comment