Welcome to my blog, today I’m briefly covering 3 different topics of interest on fixture adjustments, Premier League predictions and score effects.
How many iterations does a fixture adjustment need?
When attempted to rate a team accurately to create forecasts we are faced with a circular problem. Our output will hopefully be accurate team ratings, but to do so we need an input of accurate team ratings to be able to adjust each teams’ performance relative to their schedule!
I made an algorithm that derives team ratings from the betting odds at kickoff. (With thanks to Joseph Buchdahl @12Xpert and his very useful data downloadable from football-data.co.uk). To start with there is no fixture adjustment and the team rating is just the team’s average positive or negative supremacy (in expected goal difference per game) over their opponents.
I use these ratings to make a schedule adjustment for the first iteration. This outputs a new set of ratings which I can then put back in at the start again and so on. Figure 1 shows team ratings for the PL (in expected goal difference per game) this season using this method:
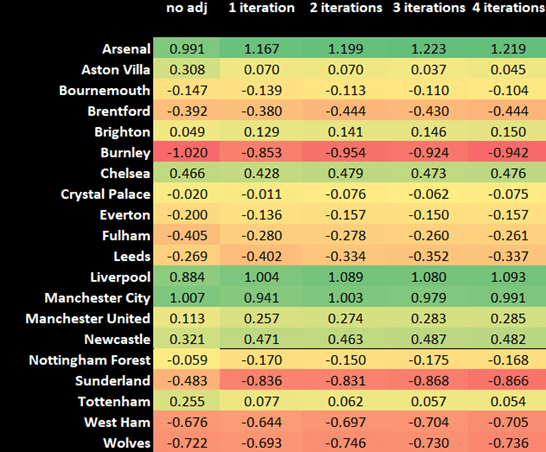
Figure 1
Consider Sunderland as an example here – many will know already that they have faced a very skewed schedule of lower ranked teams so far. You can see their rating drop sharply between no adjustment and 1 iteration (figure 1). However, after 1 iteration, every other team that has played Sunderland has been given a scheduled that includes Sunderland as a team rated as -0.48 (possibly not a level Sunderland are at). One more iteration sorts out this problem, and each following iteration shows minimal change.

Figure 2
Figure 2 compares the accuracy of these ratings against the current odds for each team in Gameweek 9 (pricing error per game). The second group of numbers is the variability of each teams derived ability game to game (lower the better).
What we can conclude from these figures is 2 iterations is a good number. Neither metric from figure 2 appreciably approves after 2 iterations and so extra iterations are not worth the time or effort.
Premier league predictions after 8 weeks
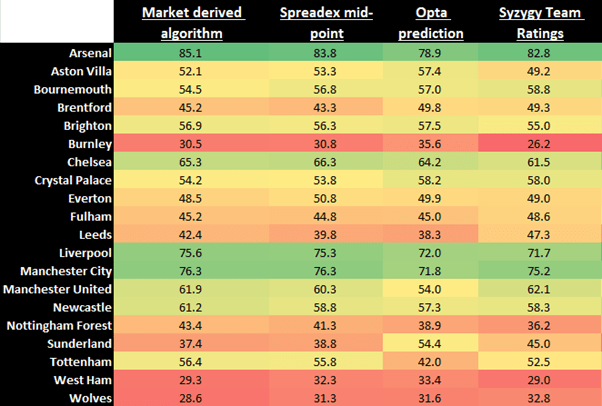
Figure 3
I hope to return to these at the end of the season to see which performed best.
I’d rate the market derived algorithm to be favourite – betting odds at kick off are really accurate. My own ratings have outliers for each of the 3 promoted teams which could be because of the small sample of games so far (for others teams I include some data from last season). Opta is 4th favourite because I think they use a unique method with a team elo rating system (the spread from best to worse might not be enough and teams like Tottenham are too low).
Game state effects with xG are not especially large
I often see people discredit trailing teams who create chances as ‘score effects’. At times it seems it’s impossible for trailing teams to be given any credit regardless of what they create.
With thanks to understat.com here are some numbers I have calculated before:

Figure 4
Raw numbers for the last 2 PL seasons show trailing teams perform worse than average by xG and goals. The third column is important – this is the expected performance of trailing teams owing to the fact that trailing teams will generally be weaker teams (the reason they are trailing to begin with). This figure is subtracted off the raw numbers to give the final 2 columns.
We can see trailing teams do score more and create more xG but it’s to the tune of around a fifth of a goal or xG per 90. If a team puts up lots of shots and 1.5xG while trailing I see no reason to dismiss the majority of it as ‘score effects’.
If you enjoyed this piece, please consider subscribing (top left on the main page) or leaving a comment! Get in touch at x.com/samh112358 about anything if you wish, thanks for reading!

Leave a comment