The season may be young but in betting, and life in general, we don’t always have the luxury of waiting for big sample sizes before making decisions. Let’s look at 2 teams that have captured my attention so far.
Tottenham Hotspur
Of all the established teams in the Premier League this season, I think accurately rating Tottenham using team performance metrics is the most difficult. This is because they spent a large part of last season a) with different players and b) focusing on the Europa League. This is a case where quantitative player ratings would be somewhat required – an area I have never focused on (and seem to be the domain of the top-level syndicates).
Today I want to note just how bad their performance was against Bournemouth.
The following graph plots the worst performance of the season against finishing position for the last 3 years (60 team seasons) in the Premier League.
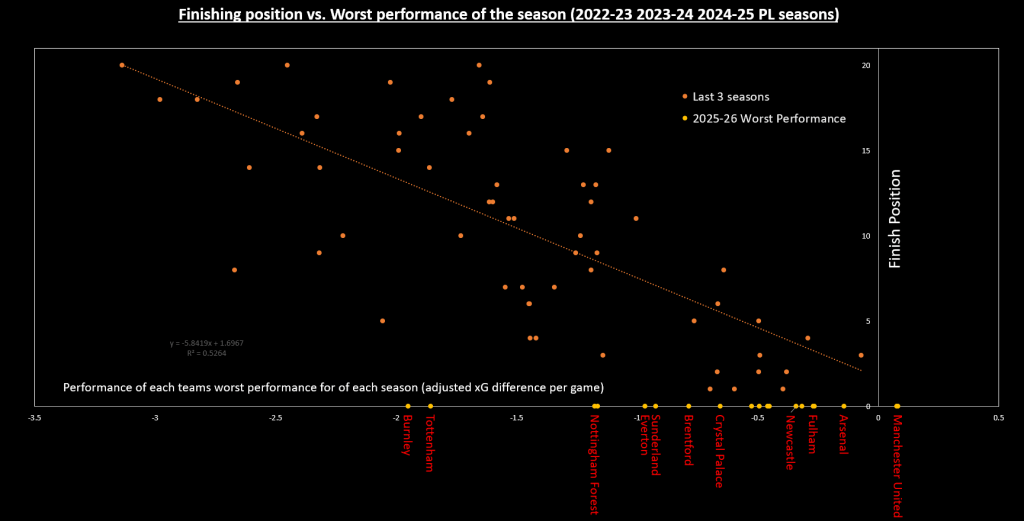
Figure 1
The worst performances of each team so far in 2025/26 are shown stuck to the x-axis. I had to remove some labels as they were on top of each other – it doesn’t matter because look at a team’s worst performance is not generally the most useful metric. It does become important when we look at a performance as bad as Spurs’ performance against Bournemouth, just to the right of -2 adjusted xG diff per game (adjusted for fixture, game states, red cards e.t.c).
The relationship between ‘worst performance’ and finishing position means Tottenham’s -1.85 adj xG performance against Bournemouth is equivalent to the worst performance for the whole season you’d expect from a team that finishes 12th or 13th.
“It’s just an outlier”, yes, but I am comparing the performance to data points that are also outliers. For example, if Tottenham finish 8th this season, they already have a performance that you woudn’t expect from an 8th placed team all season.
They have played 3 games so it could be argued that I don’t need to look at 1 game when I could look at 3. This is reasonable but I thought it interesting to emphasise just how poor they were against Bournemouth. After 2 games I was entertaining the idea that they were top 4 contenders and outside shots of the title but I’m quite confident in now saying they are outside shots for top 4 at best.
Wrexham
My rating for Wrexham so far is very poor – I have them rated rock bottom of the Championship rankings after 4 games. Their shot profile is quite skewed – they have poor shot numbers for/against but a very high shot quality. My ratings are not positive about their chances because after 4 games, big chances (BCs) only receive a fairly low weight in my ratings. I have calculated the standard deviation of BC difference for one game to be around 2, which is almost 60% of the total BCs in a game. Shots on the other hand have a standard deviation of around 6 which is around 25-30% of the total number of shots in a game. Building on this information, I created the following graph:
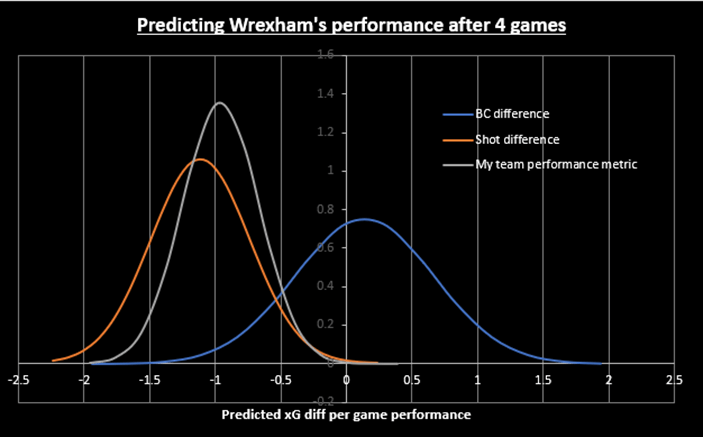
Figure 2
To create the BC and shot difference lines, I take Wrexham’s shot difference/BC difference and turn it into an xG difference (average shot = 0.11 xG average big chance = 0.4 xG). I calculate the 4 game standard deviations by dividing the standard deviation of 1 game by root(n) where n = 4. The y-axis is the ‘probability density function’ (the total area under each line is 1).
This graph shows that if we are looking simply at total shot ratio it is hard for Wrexham to be a league average team (see how little area is underneath the orange line for xG diff > 0) but if we use just big chance difference there is still a reasonable chance their performance levels are anywhere from top of the league to bottom (-1 xG per game or +1 xG per game is a big difference).
The grey line is my full team rating metric (the sharper peak is because of a lower standard deviation) which you can see is shifted somewhat towards the big chance difference but not a lot. This still says it’s hard for Wrexham to be a league average team based on their performances so far.
High value xG shots make a huge difference to xG but they are too random when we are trying to extract maximum predictive information from a small sample. I don’t have a fully quantitative way of defining this yet, but I hope to create one!

Leave a comment